Generated on 5 August 2026 · 560 cities analyzed · eclipses.app
Executive summary
The total solar eclipse of 12 August 2026 will cross the Iberian Peninsula from northwest to southeast, entering through Galicia and sweeping across Cantabria, the Basque Country, Navarre and Aragon before exiting over the Mediterranean toward the Alps. The phase of totality lasts up to 2 minutes 18 seconds along the central axis.
Of the 560 Spanish cities with more than 20,000 inhabitants analyzed that lie within the path of totality or the partial-eclipse zone, by verdict:
| Verdict | Cities | % of total | |---|:---:|:---:| | Visible | 437 | 78.0% | | Marginal | 71 | 12.7% | | Blocked by terrain | 52 | 9.3% |
δ = solar altitude − altitude of the real terrain horizon, at the Sun's azimuth, at the evaluated contact (C3 for totality, or the peak of the partial eclipse). Computed with the dense horizon sampling: 1,440 rays (0.25° step) up to 100 km away using local Copernicus DEM 30 m — see «Methodology» below for the full detail, including the change from the original report's sampling.
The verdict above is the classic visible/marginal/blocked classification. Since July 2026 the app also uses a finer, 9-category classification, which determines each city's score ceiling (see «Methodology»):
| Category | Cities | % of total | |---|:---:|:---:| | Full totality | 14 | 2.5% | | Totality at sunset | 138 | 24.6% | | Totality blocked by terrain | 3 | 0.5% | | Full annularity | 0 | 0.0% | | Annularity at sunset | 0 | 0.0% | | Annularity blocked by terrain | 0 | 0.0% | | Deep partial (>95%) | 318 | 56.8% | | Partial | 87 | 15.5% | | Not visible | 0 | 0.0% |
The 3 annular_* categories are at 0 by design, not by error: the 12 August 2026 eclipse is total, not annular — they will apply to the 2028 reports.
Of the 560 cities analyzed, 152 see full totality above the real horizon (14 with a wide margin, 138 at sunset — the Sun sets before the partial phase ends), 3 are within the path of totality but terrain blocks the central moment, and 405 only reach the partial phase (of which 318 exceed 95% obscuration).
Visibility map by autonomous community
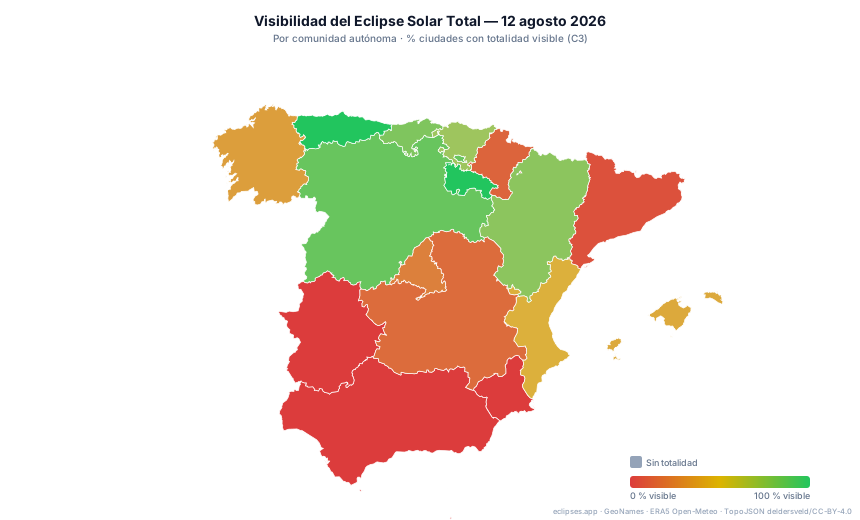
Green: high proportion of cities with totality visible. Red: low. Grey: totality does not reach the community (partial eclipse only or no eclipse).
The vector file is available at /informes/choropleth.svg for editorial use with no resolution restrictions.
Visibility by autonomous community
| Autonomous Community | Total | Totality 🌑 | Visible | Marginal | Blocked | % totality | |---|---:|---:|---:|---:|---:|---:| | Asturias | 6 | 6 | 0 | 0 | 0 | 100% ██████████ | | Cantabria | 4 | 4 | 0 | 0 | 0 | 100% ██████████ | | La Rioja | 2 | 2 | 0 | 0 | 0 | 100% ██████████ | | Castile and León | 16 | 14 | 2 | 0 | 0 | 88% █████████░ | | Aragon | 7 | 6 | 1 | 0 | 0 | 86% █████████░ | | Balearic Islands | 11 | 9 | 0 | 0 | 2 | 82% ████████░░ | | Basque Country | 21 | 14 | 4 | 1 | 2 | 67% ███████░░░ | | Valencian Community | 64 | 32 | 20 | 6 | 6 | 50% █████░░░░░ | | Galicia | 22 | 9 | 13 | 0 | 0 | 41% ████░░░░░░ | | Community of Madrid | 134 | 40 | 94 | 0 | 0 | 30% ███░░░░░░░ | | Castilla-La Mancha | 15 | 3 | 12 | 0 | 0 | 20% ██░░░░░░░░ | | Navarre | 6 | 1 | 5 | 0 | 0 | 17% ██░░░░░░░░ | | Catalonia | 113 | 12 | 32 | 43 | 26 | 11% █░░░░░░░░░ | | Andalusia | 82 | 0 | 70 | 5 | 7 | 0% ░░░░░░░░░░ | | Region of Murcia | 17 | 0 | 11 | 1 | 5 | 0% ░░░░░░░░░░ | | Canary Islands | 31 | 0 | 26 | 1 | 4 | 0% ░░░░░░░░░░ | | Extremadura | 7 | 0 | 7 | 0 | 0 | 0% ░░░░░░░░░░ | | Melilla | 1 | 0 | 1 | 0 | 0 | 0% ░░░░░░░░░░ | | Ceuta | 1 | 0 | 1 | 0 | 0 | 0% ░░░░░░░░░░ |
Direct link to each community's page with the full list of cities and individual verdicts.
Top 20 cities with totality visible
Cities within the path of totality where C3 — the end of totality — is visible above the real terrain horizon. Ordered by δ C3 (margin between solar altitude and horizon).
| # | City | Community | δ C3 (°) | Sun alt. (°) | Horizon alt. (°) | Cloud cover | |---:|---|---|---:|---:|---:|---:| | 1 | oleiros | Galicia | 11.83 | 11.8 | 0.0 | 36% | | 2 | carballo | Galicia | 10.72 | 12.1 | 1.4 | 46% | | 3 | a coruna | Galicia | 10.13 | 11.9 | 1.8 | 37% | | 4 | lugo | Galicia | 9.80 | 11.2 | 1.4 | 13% | | 5 | naron | Galicia | 9.58 | 11.8 | 2.2 | 24% | | 6 | cambre | Galicia | 9.49 | 11.9 | 2.4 | 46% | | 7 | gijon | Asturias | 9.21 | 10.1 | 0.9 | 98% | | 8 | oviedo | Asturias | 9.04 | 10.1 | 1.1 | 100% | | 9 | leon | Castile and León | 8.90 | 9.6 | 0.7 | 0% | | 10 | zamora | Castile and León | 8.69 | 9.2 | 0.6 | 17% | | 11 | ponferrada | Castile and León | 8.65 | 10.3 | 1.6 | 58% | | 12 | aviles | Asturias | 8.52 | 10.3 | 1.7 | 97% | | 13 | ferrol | Galicia | 8.39 | 11.8 | 3.5 | 12% | | 14 | medina del campo | Castile and León | 8.16 | 8.5 | 0.4 | 4% | | 15 | laguna de duero | Castile and León | 7.87 | 8.5 | 0.6 | 3% | | 16 | torrelavega | Cantabria | 7.68 | 8.9 | 1.3 | 99% | | 17 | aranda de duero | Castile and León | 7.65 | 7.8 | 0.2 | 41% | | 18 | getxo | Basque Country | 7.63 | 8.3 | 0.7 | 100% | | 19 | arteixo | Galicia | 7.58 | 12.0 | 4.4 | 51% | | 20 | san andres del rabanedo | Castile and León | 7.48 | 9.6 | 2.1 | 7% |
🌅 Eclipsed-sunset cities
A special astronomical rarity: in these 108 cities the Sun will be in visible totality (C3 above the horizon), but it will set before the partial phase ends. Observers will see the solar corona and then watch the eclipsed Sun melt into the horizon — an unusually epic finale.
| City | Community | δ C3 (°) | Sun alt. C3 (°) | Cloud cover | |---|---|---:|---:|---:| | aranda de duero | Castile and León | 7.65 | 7.8 | 41% | | segovia | Castile and León | 7.18 | 7.8 | 13% | | quintana | Community of Madrid | 6.69 | 7.3 | 12% | | concepcion | Community of Madrid | 6.65 | 7.3 | 12% | | costillares | Community of Madrid | 6.64 | 7.3 | 12% | | ciudad lineal | Community of Madrid | 6.63 | 7.3 | 9% | | almenara | Community of Madrid | 6.59 | 7.4 | 12% | | la paz | Community of Madrid | 6.58 | 7.3 | 12% | | pinar de chamartin | Community of Madrid | 6.58 | 7.3 | 12% | | algete | Community of Madrid | 6.57 | 7.2 | 21% | | tetuan de las victorias | Community of Madrid | 6.50 | 7.4 | 15% | | torrejon de ardoz | Community of Madrid | 6.46 | 7.1 | 0% | | castillejos | Community of Madrid | 6.46 | 7.3 | 12% | | pilar | Community of Madrid | 6.45 | 7.4 | 12% | | valdeacederas | Community of Madrid | 6.41 | 7.4 | 12% | | barajas de madrid | Community of Madrid | 6.41 | 7.2 | 10% | | nueva espana | Community of Madrid | 6.39 | 7.3 | 12% | | san sebastian de los reyes | Community of Madrid | 6.37 | 7.3 | 27% | | fuencarral el pardo | Community of Madrid | 6.35 | 7.4 | 20% | | valdefuentes | Community of Madrid | 6.32 | 7.3 | 12% | | pena grande | Community of Madrid | 6.31 | 7.4 | 12% | | alcala de henares | Community of Madrid | 6.29 | 7.1 | 63% | | canillas | Community of Madrid | 6.28 | 7.3 | 12% | | fuencarral | Community of Madrid | 6.26 | 7.3 | 2% | | hispanoamerica | Community of Madrid | 6.21 | 7.3 | 12% | | chamartin | Community of Madrid | 6.15 | 7.3 | 15% | | mejorada del campo | Community of Madrid | 6.15 | 7.1 | 4% | | guadalajara | Castilla-La Mancha | 6.12 | 7.0 | 17% | | calahorra | La Rioja | 6.06 | 7.0 | 46% | | canillejas | Community of Madrid | 6.04 | 7.3 | 10% | | colmenar viejo | Community of Madrid | 5.98 | 7.4 | 20% | | alcobendas | Community of Madrid | 5.97 | 7.3 | 11% | | san blas canillejas | Community of Madrid | 5.87 | 7.3 | 10% | | azuqueca de henares | Castilla-La Mancha | 5.86 | 7.0 | 16% | | coslada | Community of Madrid | 5.81 | 7.2 | 9% | | logrono | La Rioja | 5.74 | 7.4 | 9% | | zaragoza | Aragon | 5.71 | 5.9 | 30% | | san fernando de henares | Community of Madrid | 5.71 | 7.2 | 10% | | valverde | Community of Madrid | 5.69 | 7.3 | 0% | | almozara | Aragon | 5.69 | 6.0 | 30% | | simancas | Community of Madrid | 5.66 | 7.3 | 12% | | delicias | Aragon | 5.66 | 6.0 | 70% | | rosas | Community of Madrid | 5.60 | 7.3 | 10% | | mirasierra | Community of Madrid | 5.57 | 7.4 | 16% | | oliver valdefierro | Aragon | 5.54 | 6.0 | 30% | | tudela | Navarre | 5.39 | 6.6 | 59% | | tres cantos | Community of Madrid | 5.35 | 7.4 | 21% | | cuenca | Castilla-La Mancha | 5.28 | 6.0 | 1% | | torrelodones | Community of Madrid | 5.03 | 7.6 | 12% | | pinar del rey | Community of Madrid | 4.85 | 7.3 | 12% | | hortaleza | Community of Madrid | 4.85 | 7.3 | 12% | | collado villalba | Community of Madrid | 4.70 | 7.6 | 37% | | soria | Castile and León | 4.56 | 7.0 | 21% | | requena | Valencian Community | 4.55 | 5.0 | 17% | | teruel | Aragon | 4.50 | 5.4 | 18% | | lleida | Catalonia | 4.28 | 5.0 | 32% | | betera | Valencian Community | 3.97 | 4.6 | 27% | | lliria | Valencian Community | 3.73 | 4.7 | 31% | | alboraya | Valencian Community | 3.69 | 4.5 | 34% | | burjassot | Valencian Community | 3.58 | 4.5 | 22% | | mislata | Valencian Community | 3.57 | 4.5 | 34% | | quart de poblet | Valencian Community | 3.54 | 4.5 | 27% | | la pobla de vallbona | Valencian Community | 3.52 | 4.7 | 27% | | paterna | Valencian Community | 3.49 | 4.5 | 27% | | castello de la plana | Valencian Community | 3.47 | 4.5 | 24% | | cullera | Valencian Community | 3.47 | 4.3 | 15% | | manises | Valencian Community | 3.45 | 4.5 | 27% | | catarroja | Valencian Community | 3.37 | 4.5 | 32% | | sueca | Valencian Community | 3.34 | 4.3 | 10% | | xirivella | Valencian Community | 3.33 | 4.5 | 34% | | ribarroja del turia | Valencian Community | 3.32 | 4.6 | 32% | | alfafar | Valencian Community | 3.31 | 4.5 | 32% | | valencia | Valencian Community | 3.31 | 4.5 | 34% | | paiporta | Valencian Community | 3.26 | 4.5 | 32% | | sant antoni de portmany | Balearic Islands | 3.21 | 3.1 | 4% | | aldaia | Valencian Community | 3.17 | 4.5 | 27% | | torrent | Valencian Community | 3.14 | 4.5 | 20% | | moncada | Valencian Community | 3.08 | 4.5 | 22% | | almassora | Valencian Community | 3.05 | 4.5 | 22% | | benicarlo | Valencian Community | 3.01 | 4.4 | 10% | | algemesi | Valencian Community | 3.00 | 4.5 | 23% | | tarragona | Catalonia | 3.00 | 4.3 | 22% | | alaquas | Valencian Community | 2.98 | 4.5 | 27% | | vila real | Valencian Community | 2.97 | 4.5 | 22% | | calatayud | Aragon | 2.96 | 6.3 | 49% | | burriana | Valencian Community | 2.91 | 4.5 | 20% | | vinaros | Valencian Community | 2.83 | 4.4 | 9% | | salou | Catalonia | 2.70 | 4.3 | 21% | | vilanova i la geltru | Catalonia | 2.53 | 4.1 | 23% | | vila seca | Catalonia | 2.53 | 4.3 | 21% | | grao de murviedro | Valencian Community | 2.08 | 4.5 | 20% | | reus | Catalonia | 1.90 | 4.4 | 21% | | ciutadella | Balearic Islands | 1.88 | 2.0 | 1% | | manacor | Balearic Islands | 1.79 | 2.2 | 6% | | llucmajor | Balearic Islands | 1.77 | 2.3 | 18% | | amposta | Catalonia | 1.69 | 4.5 | 2% | | sagunto | Valencian Community | 1.41 | 4.5 | 41% | | cambrils | Catalonia | 1.39 | 4.4 | 16% | | calafell | Catalonia | 1.21 | 4.2 | 14% | | tortosa | Catalonia | 1.01 | 4.6 | 5% | | onda | Valencian Community | 0.87 | 4.6 | 23% | | santa eularia des riu | Balearic Islands | 0.74 | 2.9 | 2% | | valls | Catalonia | 0.47 | 4.4 | 18% | | el vendrell | Catalonia | 0.40 | 4.2 | 14% | | mao | Balearic Islands | 0.30 | 1.7 | 1% | | calvia | Balearic Islands | 0.06 | 2.6 | 25% | | ibiza | Balearic Islands | -0.04 | 3.0 | 5% | | marratxi | Balearic Islands | -0.10 | 2.5 | 19% |
In these cities the calculator will show the special "eclipsed sunset" verdict. They are ideal candidates for photographic coverage and long-exposure video.
Top 20 cities with partial eclipse visible
Cities outside the path of totality where the maximum of the partial eclipse is visible. Ordered by δ descending.
| # | City | Community | δ (°) | Sun alt. (°) | Horizon alt. (°) | Cloud cover | |---:|---|---|---:|---:|---:|---:| | 1 | vigo | Galicia | 12.01 | 11.7 | -0.3 | 30% | | 2 | guia de isora | Canary Islands | 11.72 | 11.0 | -0.7 | 2% | | 3 | tacoronte | Canary Islands | 11.53 | 10.8 | -0.7 | 18% | | 4 | icod de los vinos | Canary Islands | 11.46 | 11.0 | -0.4 | 3% | | 5 | la orotava | Canary Islands | 11.44 | 10.9 | -0.6 | 18% | | 6 | santiago de compostela | Galicia | 11.27 | 11.9 | 0.6 | 3% | | 7 | adeje | Canary Islands | 11.17 | 10.9 | -0.3 | 1% | | 8 | lalin | Galicia | 11.11 | 11.5 | 0.4 | 22% | | 9 | ribeira | Galicia | 11.04 | 11.8 | 0.7 | 37% | | 10 | puerto de la cruz | Canary Islands | 11.01 | 10.9 | -0.1 | 18% | | 11 | vilagarcia de arousa | Galicia | 10.62 | 11.9 | 1.3 | 10% | | 12 | a estrada | Galicia | 10.22 | 11.8 | 1.6 | 24% | | 13 | los realejos | Canary Islands | 9.80 | 10.9 | 1.1 | 18% | | 14 | marin | Galicia | 9.77 | 11.8 | 2.0 | 33% | | 15 | la laguna | Canary Islands | 9.14 | 10.8 | 1.6 | 16% | | 16 | ponteareas | Galicia | 9.13 | 11.6 | 2.4 | 22% | | 17 | arucas | Canary Islands | 9.09 | 9.9 | 0.8 | 24% | | 18 | pontevedra | Galicia | 9.00 | 11.8 | 2.8 | 0% | | 19 | galdar | Canary Islands | 8.88 | 10.0 | 1.1 | 47% | | 20 | los llanos de aridane | Canary Islands | 8.78 | 12.2 | 3.4 | 4% |
Cities in the marginal zone (outreach opportunities)
These cities are technically on the edge: the Sun clears the horizon by less than 1.5°. A raised vantage point a few kilometers away can tip the balance to visible.
| # | City | Community | δ (°) | Sun alt. (°) | |---:|---|---|---:|---:| | 1 | motril | Andalusia | 1.49 | 5.3 | | 2 | manresa | Catalonia | 1.44 | 4.3 | | 3 | sagunto | Valencian Community | 1.41 | 4.5 | | 4 | cambrils | Catalonia | 1.39 | 4.4 | | 5 | adra | Andalusia | 1.30 | 4.9 | | 6 | calafell | Catalonia | 1.21 | 4.2 | | 7 | javea | Valencian Community | 1.21 | 3.8 | | 8 | sant adria de besos | Catalonia | 1.19 | 3.9 | | 9 | ciutat vella | Catalonia | 1.17 | 3.9 | | 10 | sant pere santa caterina i la ribera | Catalonia | 1.12 | 3.9 |
Downloadable data files
| File | Description | Use | |---|---|---| | ranking.csv | Full ranking of 560 cities | Analysis, spreadsheet | | outreach/.json | Per-community JSON with statistics + listing | Segmented media campaign | | choropleth.svg | Vector SVG map | Editorial infographics |
Structure of the outreach JSON
{
  "admin1Code": "PV",
  "admin1Name": "País Vasco",
  "stats": {
    "total": 5,
    "totality": 4,
    "visible": 0,
    "marginal": 1,
    "pctTotality": 80.0,
    "pctVisible": 0.0
  },
  "cities": [
    {
      "slug": "bilbao",
      "name": "Bilbao",
      "verdict": "visible",
      "verdictTarget": "C3",
      "partialEndStatus": "visible",
      "delta": 2.34,
      "url": "https://eclipses.app/es/eclipse-2026/bilbao"
    }
  ]
}
Methodology
Dual-verdict model
Since sprint 7, the calculator computes two verdicts per city:
- Primary: evaluates C3 (end of totality) for cities in the path of totality, or the peak of the partial eclipse for the rest.
- Partial end: always evaluates C4 (end of the partial eclipse). If
partialEnd.status = below_horizon, the Sun sets before the partial phase ends — the "eclipsed sunset".
Visibility categories (9)
From the dual verdict and the eclipse kind, getVerdictCategory() (src/lib/eclipse/verdict-category.ts) classifies each city into one of 9 categories: totality_full / totality_sunset / totality_blocked (for a total eclipse), annular_full / annular_sunset / annular_blocked (equivalents for annular — not applicable to this eclipse, which is total), partial_deep (obscuration > 95%) / partial_only (the rest of partials), and not_visible (no eclipse, or the Sun was never above the astronomical horizon for the whole relevant window — stricter than "blocked by terrain", which is still counted as partly seen). This classification has replaced, since July 2026, the binary visible/marginal/blocked model used by the first version of this report (9 May 2026), and it is what determines each city's score ceiling (see below).
Visibility score 0-100 (v2)
Since 26 July 2026 the score combines two axes — visibility (eclipse kind + horizon margin + duration: pure geometry, deterministic, never changes for a given point and date) and sky (cloud climatology, null when there is no data, never penalized) — blended 85/15 when sky data is available, and capped by hard ceilings based on the verdict category (e.g. any partial eclipse or a totality blocked by terrain caps at 50; a totality seen at sunset caps at 85). It replaces v1 (a plain sum of 4 components with no caps), which let an almost-total partial score nearly as high as a real totality. Full formula, constants and worked examples in docs/SCORE_FORMULA.md.
Real-horizon computation
For each city we determine whether the Sun will be above the real topographic horizon (not the geometric one) at the key instant. The process:
- Astronomical position — astronomy-engine (Meeus algorithms, precision < 1″ of arc).
- Horizon profile — with local Copernicus DEM 30 m covering the point (the case for all 560 Spanish cities),
buildHorizonProfiletraces 1,440 rays (0.25° step) with fine sampling up to 100 km away, adaptive pruning (a ray is cut short once even a 3,800 m peak could no longer beat the horizon already found), summit refinement to 60 m resolution, and output aggregated into 6 distance bands. Without local DEM coverage, it falls back to coarser sampling — 72 azimuths × 11 distances (792 points) — queried remotely: Open-Meteo elevation API → Open-Elevation → Open-Topo-Data SRTM 30 m, in that order. - Physical corrections — Earth curvature and standard atmospheric refraction.
- Verdict — δ = solar altitude − real horizon altitude at the solar azimuth, at the evaluated contact.
Why this report's figures differ from the 9 May 2026 version: the first version described (and used) much coarser sampling — every ~1° at 7 fixed distance rings (0.5 to 25 km) — which became obsolete that same sprint (S23) once it was found to underestimate the real horizon in areas of marked relief: the Orellán ridge, at 27.3 km, fell directly outside the range (the furthest ring reached only 25 km), and that area's verdict came out ~1° more optimistic than reality. The dense 1,440-ray sampling up to 100 km fixes that blind spot. The decision threshold did NOT change (δ > 1.5° visible · −0.5° to 1.5° marginal · < −0.5° blocked by terrain); what changed is how much terrain is examined before applying it — and that is what moves this report's figures relative to the May version.
Cloud-cover climatology
Correction from the May version: the figure shown in this report's tables ("Cloud cover" column) is location_cloud_score.median_cover, the historical median cloud cover (0-100%, lower is better) — NOT the "probability of clear skies" the original report claimed, which is the opposite and was never actually what was computed. Actual computation: for each city, Open-Meteo (ERA5 reanalysis, via the /v1/archive API) is asked for hourly cloud_cover data on the same month-day as the eclipse (12 August) for each of the last 10 years, and the value for the hour closest to the eclipse instant is taken, at the city's exact point — NOT along the Sun's path from C2 to C4 as the previous version claimed (that is a different, real-time calculation used for short-range forecasts — not this climatology), and NOT averaged over a multi-day window: it is a single point (the city's lat/lon) and a single hour per year, with up to 10 yearly samples. This is historical climatology, not a forecast: for dates ≤16 days out, eclipses.app uses real Open-Meteo forecast data instead.
Sources
- GeoNames cities5000 (cities > 20,000 inhab., CC-BY license)
- astronomy-engine v2 (MIT) — topocentric ephemerides
- Copernicus DEM 30 m local — primary horizon source; remote fallback Open-Meteo elevation API → Open-Elevation → Open-Topo-Data SRTM 30 m
- Open-Meteo archive API (ERA5) — cloud-cover climatology
- TopoJSON deldersveld/topojson (CC BY 4.0)
- Source code: eclipses.app
Interactive calculator available at eclipses.app — enter any point on the map to get the exact verdict with horizon profile, local C4 time and cloud-cover forecast.